Migration and Migrant Population Statistic
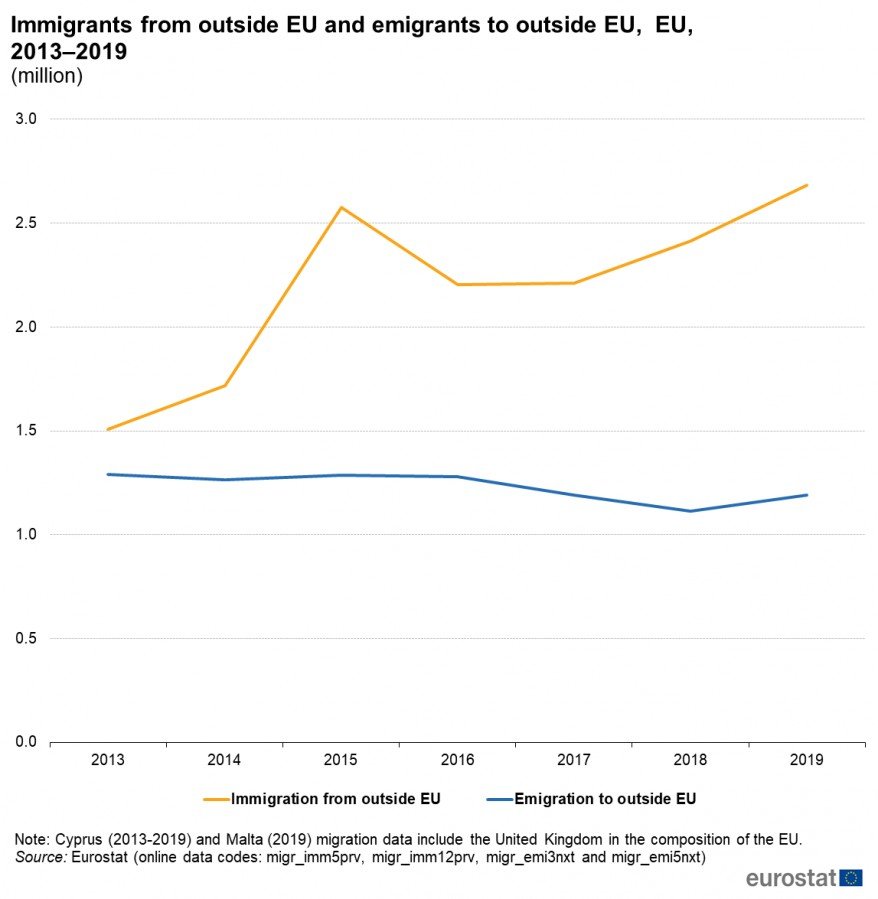
In 2019, 4.2 million people moved to EU Member States. Of these, 2.7 million came from non-EU countries, while 1.4 million migrated between EU countries. Around 1.2 million left the EU for destinations outside its borders.
On 1 January 2020, approximately 23 million non-EU citizens lived in the EU, representing 5.1% of the total population.
Immigration and Emigration by Country
- Germany saw the highest number of immigrants (886,000) and emigrants (576,000).
- Other top destinations: Spain, France, and Italy.
- Most EU countries had more immigration than emigration, except Bulgaria, Croatia, Latvia, Denmark, and Romania.
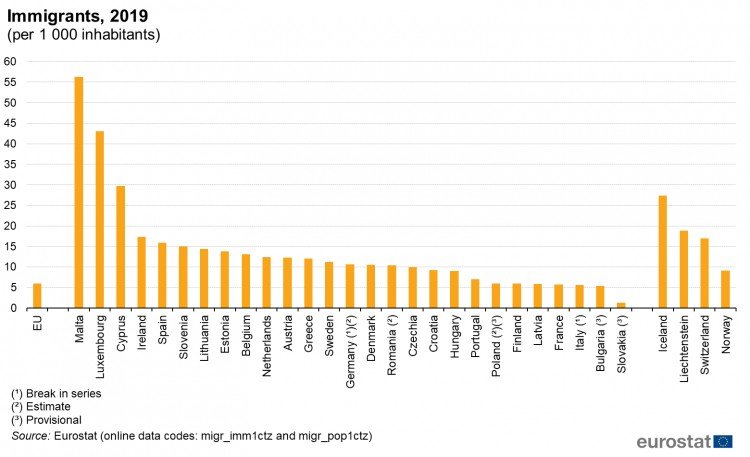
Immigration Rates by Population Size
- Malta had the highest immigration rate in 2019 (56 per 1,000 residents), followed by Luxembourg (43 per 1,000).
- For emigration, Luxembourg, Cyprus, and Malta had the highest rates.
National vs. Foreign Immigrants
Some countries saw high numbers of returning nationals:
- Romania (80%), Slovakia (65%), and Bulgaria (62%) had the highest shares of nationals among new immigrants.
- In contrast, Czechia reported that less than 4% of its immigrants were nationals.
Native-Born Immigrants
Using country of birth rather than citizenship reveals different patterns:
- Bulgaria (59%), Romania (49%), and Lithuania (46%) had the highest shares of native-born immigrants.
- Luxembourg and Spain had the lowest, with native-borns making up 5% or less of new arrivals.
Country of Birth and Previous Residence
In 2019, EU migration data by country of birth showed that many immigrants were foreign-born, but a notable share were native-born returnees in some countries. For example, Bulgaria, Romania, and Lithuania had some of the highest shares of immigrants born in the country they moved to.
Looking at the previous country of residence, Luxembourg had the highest share of immigrants coming from another EU Member State (91%), followed by Austria (63%) and Slovakia (60%). In contrast, Spain and Slovenia saw much lower EU-to-EU mobility, with only 16% of immigrants coming from another EU country.
Gender and Age Distribution
Immigration in 2019 was slightly male-dominated:
- Men: 54%
- Women: 46%
Croatia had the highest share of male immigrants (77%), while Cyprus reported the most female immigrants (53%).
In terms of age, immigrants were significantly younger than the general EU population:
- Median age of immigrants: 29.2 years
- Median age of EU population: 43.9 years
This younger age profile highlights the role of migration in offsetting population aging across the EU.
Migrant Population by Citizenship
As of 1 January 2020, there were:
- 23 million non-EU citizens living in the EU (5.1% of the population)
- 13.5 million EU citizens living in another EU country
The highest numbers of non-nationals were found in:
- Germany (10.4 million)
- Spain (5.2 million)
- France (5.1 million)
- Italy (5.0 million)
These four countries hosted 71% of all non-nationals in the EU, although they comprised just 58% of the EU’s population.
Who Are the Non-Nationals?
As of 1 January 2020, most non-nationals in most EU Member States were citizens of non-EU countries. However, most non-nationals came from other EU countries, such as Belgium, Ireland, Luxembourg, Austria, and Slovakia.
In Latvia and Estonia, a large share of non-nationals were stateless persons, mainly former Soviet Union citizens who had not obtained another nationality.
Countries with the Largest Foreign Populations
- Luxembourg had the highest share of non-nationals (47%) in its population.
- Other countries with over 10% non-national residents included Malta, Cyprus, Austria, Estonia, Latvia, Ireland, Germany, Belgium, and Spain.
- The lowest shares were in Poland (0.9%) and Romania (0.7%).
Foreign-Born Residents
- The highest shares of foreign-born populations were found in Luxembourg (48%), Malta (23%), and Cyprus (22%).
- Poland, Bulgaria, Slovakia, and Romania had the lowest, under 4%.
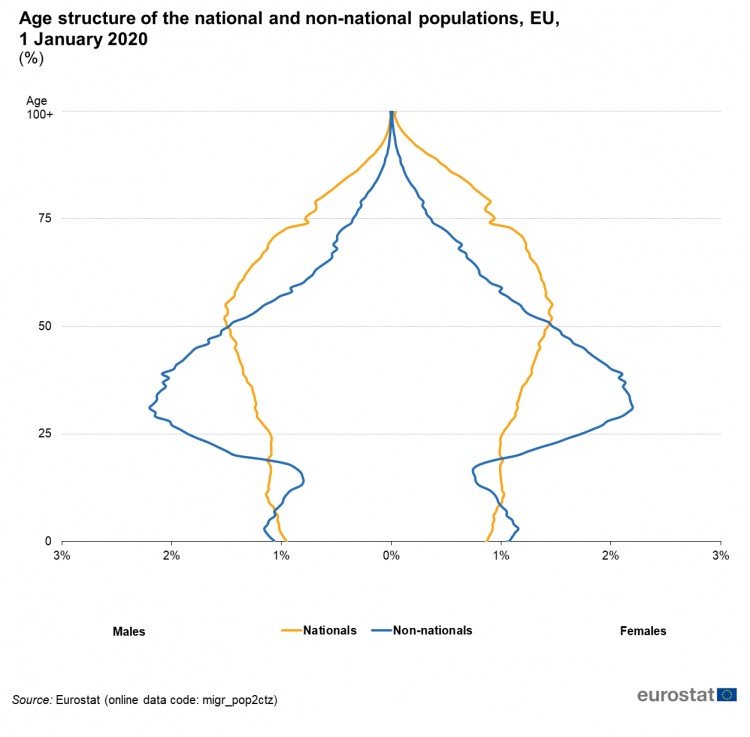
Age Profile: Foreigners Are Younger
Foreign residents in the EU were generally younger than nationals:
- Median age of non-nationals: 36 years
- Median age of nationals: 45 years
This younger demographic makes foreign populations important for economic activity and labor market support.
Citizenship Acquisition in the EU
In 2019, 706,400 people acquired EU citizenship – a 5% increase from 2018.
- Germany led with 132,000 new citizens (19% of the total), followed by Italy, France, Spain, and Sweden.
- Germany (+15,200) and Italy (+14,500) significantly increased.
- Greece (-11,500) and Ireland (-2,400) were the most significant decreases.
Who Gained Citizenship?
- 85% of new citizens were previously non-EU nationals.
-
Most were from Africa (26%), non-EU Europe (26%), Asia (18%), and the Americas (15%).
-
- 13% were EU nationals gaining citizenship in another EU Member State.
Countries like Luxembourg and Hungary saw many EU nationals, mostly Portuguese in Luxembourg and Romanians in Hungary, become citizens.
Top 10 Nationalities Gaining EU Citizenship in 2019:
- Moroccans – 66,800
- Albanians – 41,700
- Britons – 29,800
- Syrians – 29,100
- Turks – 28,600
- Romanians – 26,600
- Brazilians – 23,500
- Ukrainians – 18,100
- Algerians – 18,000
- Russians – 16,400
Notably, British citizenship acquisitions rose by 84%, likely influenced by Brexit, while Syrian acquisitions rose by 82%.
Naturalisation Rates Across the EU
One key measure of integration is the naturalisation rate – the number of people granted citizenship relative to the foreign population.
In 2019, the highest naturalisation rates were seen in:
- Sweden (7.0 per 100 non-nationals)
- Romania (4.7)
- Portugal (4.4)
- Followed by Finland, the Netherlands, and Belgium
By contrast, the lowest rates were recorded in:
- Lithuania (0.2)
- Denmark, Estonia, Czechia, and Latvia (all below 1)
- Other low-rate countries included Austria, Bulgaria, Slovakia, Malta, and Ireland
These figures highlight the wide variation in how EU countries grant citizenship, which is often influenced by national policies and administrative processes.
Data Sources and Methodology
The data in these analyses comes from Eurostat, which gathers annual statistics from EU Member States and EFTA countries. These include:
- Migration flows
- Stocks of non-national residents
- Acquisitions of citizenship
Why Emigration Is Harder to Track
Tracking people leaving a country is more difficult than recording arrivals. As a result, Eurostat focuses primarily on immigration data, which tends to be more reliable.
Legal Basis for EU Migration Data
Since 2008, data collection has been governed by Regulation 862/2007, ensuring consistency across Member States. It covers statistics on:
- Immigration/emigration (for stays of 12+ months)
- Population by citizenship and country of birth
- Residence permits and asylum
- Citizenship acquisitions
Most countries rely on administrative records, but others also use surveys or estimations. Standard definitions and methods help improve accuracy and comparability across the EU.
Age Definitions in Data
In most EU countries, age data for migration and citizenship in 2019 referred to age at the end of the year. However, Ireland, Greece, Austria, Malta, Romania, and Slovenia reported age based on the last birthday.
Inclusion of Asylum Seekers and Refugees in Statistics
Data reporting varied across Member States:
- For population data, countries like Belgium, Germany, France, and Italy included asylum seekers and refugees who had resided for over 12 months.
- Countries such as Poland, Romania, and Sweden excluded them.
- A similar split was applied for migration data, with Switzerland and Norway included in the reporting group.
⚠️ Definitions matter: “Refugee” includes those under subsidiary protection or granted humanitarian stay, not just UN-defined refugees.
EU Policy Context on Migration
EU citizens enjoy free movement, but policies for non-EU nationals are more selective, focusing on:
- Skill-based migration (language, education, work experience)
- Preventing illegal migration and trafficking
- Supporting integration
Key Policy Developments
- 2004–2010: Policy plans on legal migration and illicit immigration controls were introduced.
- 2015: The European Agenda on Migration addressed the Mediterranean crisis.
- 2020: The New Pact on Migration and Asylum proposed a more unified, fair system balancing protection and border control.
Legal Framework
Several EU treaties and directives guide migration, asylum, and citizenship policy. Notable examples include:
- Directive 2004/38/EC – Free movement for EU citizens and families
- Directive 2003/86/EC – Right to family reunification
- Directive 2011/95/EC – Standards for international protection
- Directive 2013/32/EU – Common asylum procedures
- Directive 2014/36/EU – Seasonal workers
- Directive 2016/801/EU – Rules for students and researchers
These laws ensure harmonized migration practices and rights across Member States.

 Mary Watson

 Mary Watson